Spectral Sensor Solutions
  • Home
  • Applications
    • Environmental Sensing >
      • Industrial
      • Agriculture
      • Regulation / Verification
      • Science
      • Capabilities >
        • Modeling / Simulation
        • HW/SW Prototype Development
        • Field Deployment & Testing
      • Environmental Sensing Publications
    • Threat Sensing >
      • Threat Sensing Publications
  • Technology
    • Integrated Path Spectroscopy
    • Airborne CW LIDAR
    • Elastic Backscatter Lidar
    • UV RAMAN
  • Products
    • GreenLITE™
    • MFLL Multifunctional Fiber Laser Lidar
    • Reveal
    • CSD
    • MANPORTABLE
  • About S3
  • Contact Us

Standoff UV Raman Spectroscopy

Spectral Sensor Solutions (S3) has been integrating UV Raman spectroscopy techniques into various standoff sensors to provide rapid and sensitive detection and identification of chemical compounds that might be present on surfaces. 

Raman Spectroscopy

Raman spectroscopy is a non-contact detection and identification technique well suited for the detection of liquid and solid contamination on surfaces. It entails the irradiation of suspected contaminated surface with a monochromatic laser and spectroscopically analyzing the backscattered light. A spectrum corresponding to characteristic vibrational frequencies of the contaminant is obtained to the red of the laser wavelength. These Raman lines are shifted from the excitation wavelength by amounts equal to the vibrational frequencies of the molecule, providing Raman spectroscopy with the ability to differentiate structurally similar chemicals.

UV Raman

The Raman spectrum is extremely weak, typically 1 part in 104 to 106 of the excitation intensity. But the Raman cross section itself is dependent on the excitation wavelength to the inverse fourth power resulting in higher Raman intensity with shorter wavelength laser excitation. This is one of the main advantages to using UV laser excitation for detecting agents on surfaces. Another advantage is that shifting to excitation wavelengths below about 250 nm actually shifts the Raman spectrum away from the tryptophan fluorescence band found in biological material. At higher wavelengths, the tryptophan fluorescence can obscure the weaker Raman signals. The final advantage to UV excitation is that Raman spectrum is manifest in the solar blind region of the spectrum.

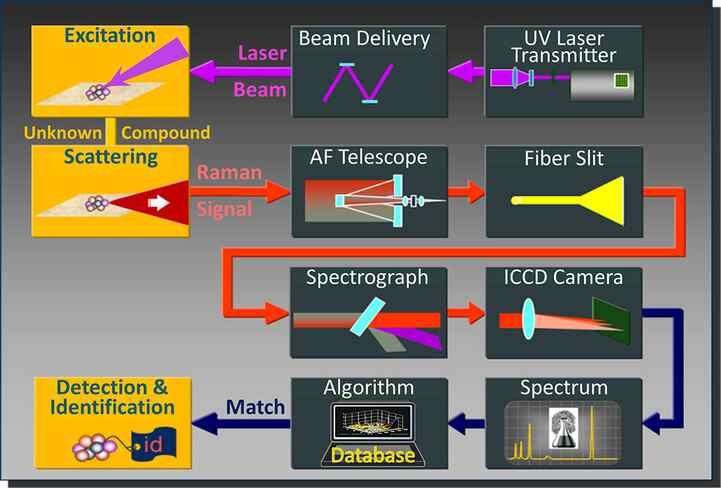
Sensor Architecture

Picture
S3 sensors share a common architecture depicted in the figure above. A UV laser pulse is transmitted and illuminates the surface being interrogated. Chemical compounds present on the surface scatter the excitation laser light within the whole solid angle and a small portion is collected by the receiver telescope. This collected scattered light is coupled to a fiber bundle, providing the input slit of a spectrograph. The dispersed Raman spectrum is imaged on an intensified camera to create the digital  Raman signature for that chemical compound.  This signature is then compared to a database of known compounds to generate a match or no match result. Both, the MANPORTABLE​ sensor and the CSD sensor, use this configuration. 
Environmental Sensing  |  Threat Sensing  |  Technology  |  Products  | About S3  | Contact Us | Log In
Picture
Picture
  • Home
  • Applications
    • Environmental Sensing >
      • Industrial
      • Agriculture
      • Regulation / Verification
      • Science
      • Capabilities >
        • Modeling / Simulation
        • HW/SW Prototype Development
        • Field Deployment & Testing
      • Environmental Sensing Publications
    • Threat Sensing >
      • Threat Sensing Publications
  • Technology
    • Integrated Path Spectroscopy
    • Airborne CW LIDAR
    • Elastic Backscatter Lidar
    • UV RAMAN
  • Products
    • GreenLITE™
    • MFLL Multifunctional Fiber Laser Lidar
    • Reveal
    • CSD
    • MANPORTABLE
  • About S3
  • Contact Us