SCANNING EYE-SAFE ELASTIC BACKSCATTER LIDAR
Direct-detection atmospheric lidars transmit a laser pulse through the atmosphere and the backscattered (180 degrees) light resulting from molecular and aerosol interactions with the laser beam are collected by a telescope. The collected temporal signal is analyzed and provides an indication of scattering intensity versus distance traveled by the laser pulse.
Lidar Sensor Configuration
Direct-detection atmospheric lidars transmit a laser pulse through the atmosphere and the backscattered (180 degrees) light resulting from molecular and aerosol interactions with the laser beam are collected by a telescope. The collected temporal signal is analyzed and provides an indication of scattering intensity versus distance travelled by the laser pulse.
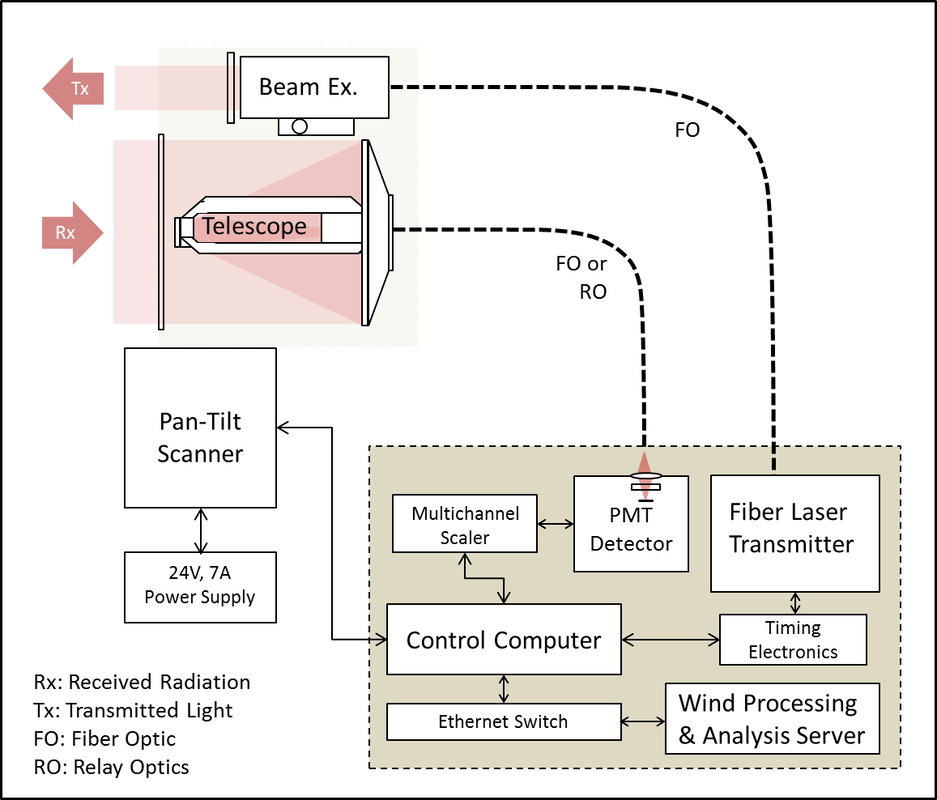
S3 Scanning Eye-Safe Elastic Backscatter Lidar Architecture
|
Concentration Maps and Wind Derivation
The elemental lidar data is a voxel (volume element) corresponding to the number of backscattered photons from a volume located at a given range and a given pointing direction from the sensor. As is, the data can be displayed directly in the form of a Range Time Indicator (RTI), where range-resolved returns are color coded and stacked parallel in order of arrival to create a two dimensional (2D) plot.
To create a dimensionally correct representation of the data, the sector scan data associated with horizontal scans are displayed as Planned Position Indicators (PPI) where the range and bearing (azimuth angle) information are used to position each voxel as color-coded pixels in a radial or Cartesian 2D plot.
When 2 PPI scans are successively generated, analyzing the changes in aerosol distributions between these 2 scans provides an estimation of the atmospheric motions that took place in the time interval separating these 2 scans. As a result, a 2D wind field can be derived from this analysis using cross correlation and wavelet-based optical flow algorithms. S3 lidars have integrated these wind fields estimation techniques that were developed by Dr. Shane Mayor at California State University – Chico.
This technology can significantly improve the characterization of plume dynamics as well as the dynamics of the atmospheric environment in which the plume evolves.
